

After spending a few weeks running self-hosted tools individually on a puny Raspberry Pi Zero, I made the shift to Docker. Containerizing self-hosted tools has numerous advantages over running them individually because one hiccup results in a total system halt. Docker’s container isolation makes it easy to manage, and Portainer was the very first thing I used. My first impression was good because I finally got a visual tool to manage my Docker containers and didn’t need to spin up compose files or run long commands in the terminal.
Prometheus and Grafana were the next additions because Portainer didn’t offer me any sort of hardware monitoring. After spending a good amount of time with these tools, I’ve finally made my shift to Dockhand, Beszel, and Glance. This trio fulfills all of my container management, monitoring, and dashboard needs, and fills huge gaps existing in the previous stack.
Picking Dockhand over Portainer
I crave simplicity
Portainer isn’t a bad tool by any means. I’ve used it extensively for almost all of my Docker journey because I want to keep terminal interaction to a minimum. As a Windows user, I’ve always been a GUI-inclined person, and when Portainer can offer that for a mere 100 MB resource usage, I’m all up for it.
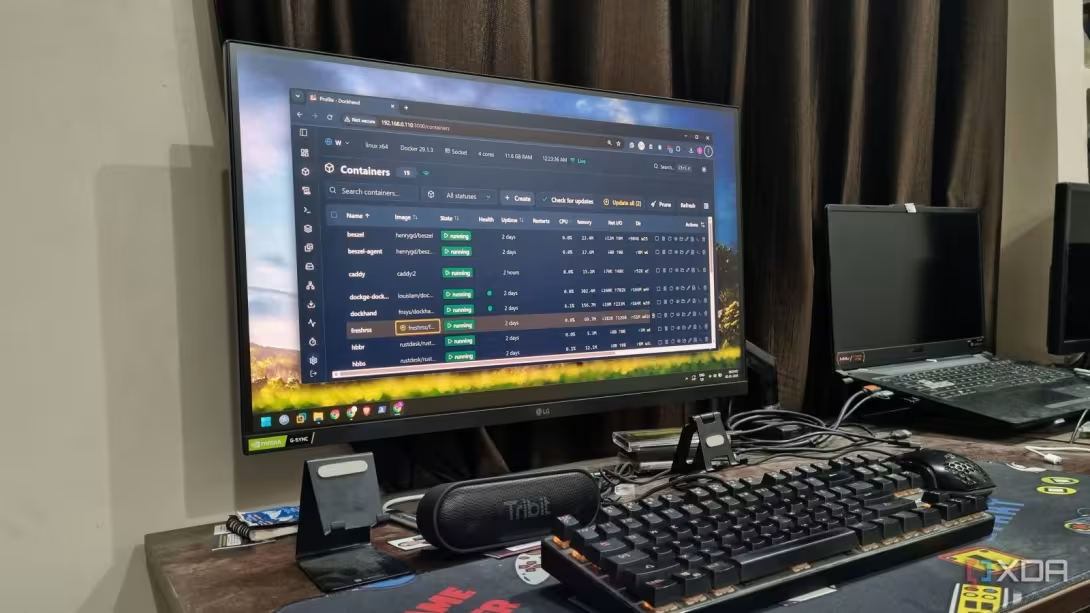
The biggest problem for me with Portainer is the UI design. It tries to squeeze in everything in the app, and I don’t need those features. The main dashboard lacks details and only shows the connected environment with a few other details. Dockhand shows more information in a presentable manner that’s easy on my eyes.
If you use Portainer, there’s a high chance that you spend most of your time on the Containers page. I don’t know how Portanier missed it, but if you want to take an action on a container, you must first select it and then use the top bar to do an action like start, stop, restart, etc. Dockhand shows quick actions next to each container, which is convenient. I can modify the visual appearance to make the whole interface easier on the eyes.
Even the stack creation and management experience is much better. I don’t need to scroll through a huge page to type the compose file content and then add environment variables. Everything is available in a single-page format. Another good thing about Dockhand is that it makes container updates child’s play. I can simply check for updates from the container management page, and it highlights all those that have a new image.
Portainer doesn’t have any kind of update button for such tasks, and the only option is to either recreate each container, which pulls the newest image from DockerHub. Or you can set up Watchtower to manage updates, but that project is no longer in active maintenance, and you have to use forks or find another tool.

Ditching Grafana and Prometheus
Beszel is better
I’m always amazed at how Beszel managed to put out such a visually nice tool with such a small resource footprint. I used Grafana and Prometheus in my early days, but that was a horrible experience. Grafana is an absolute no for a beginner and requires you to put time into configuring what resources you want to monitor. Even if you manage to do that, the tool is more suitable for a serious, enterprise environment rather than a small home lab with a few servers.
I can also not ignore Grafana’s heavy resource usage and how it impacts my low-end servers. Beszel, on the other hand, doesn’t even consume 50 MB when it's active and shows me rich, pre-configured graphs after deployment. Beszel keeps the complexity aside and only requires you to set up an agent on every machine.
Monitoring multiple Docker systems is possible in Beszel, and I can take a peek at my Raspberry Pi and old laptop’s current usage with the web UI. Beszel’s focused on simplicity and also has an alert system baked into it. It can trigger alerts on the dashboard whenever a certain hardware use exceeds the programmed limit. Even if you don’t want to use the alerts, the tool is sufficient for occasional checks and the container’s status.
Glance adds a dashboard
No more tab struggles

Glance replaces my need to open, pin, and bookmark several tabs. It helps me build a single-page dashboard that can display the status of my Docker systems, active containers, and combine it with other information such as RSS feeds, YouTube and Twitch activity, weather, and more. It’s my default home page of the browser because it shows me a lot of information on a single page and lets me decide which course to take.
I don’t open Dockhand unless I need to edit or modify the containers. Since Glance can show whether the container or service is active or not, I can take instant action from the dashboard. Clicking on a container item redirects me to its web UI, and I don’t need to add bookmarks or open Dockhand for such a trivial purpose.
Glance supports granular customization to add or remove elements using the YML file. I can add more elements and build a multiple-page dashboard, but I’m content with the current view.
Lean, feature-rich, and less confusing
Letting go of Grafana, Prometheus, and Portainer makes my setup lean and doesn’t inflict load on my system resources. I don’t have to think twice before deploying my new trio on any device, be it an SBC, mini PC, or a desktop. The trio is visually appealing, packs features I need for container management, updates, monitoring, and access, and suits a small-scale home labber like me.